All guides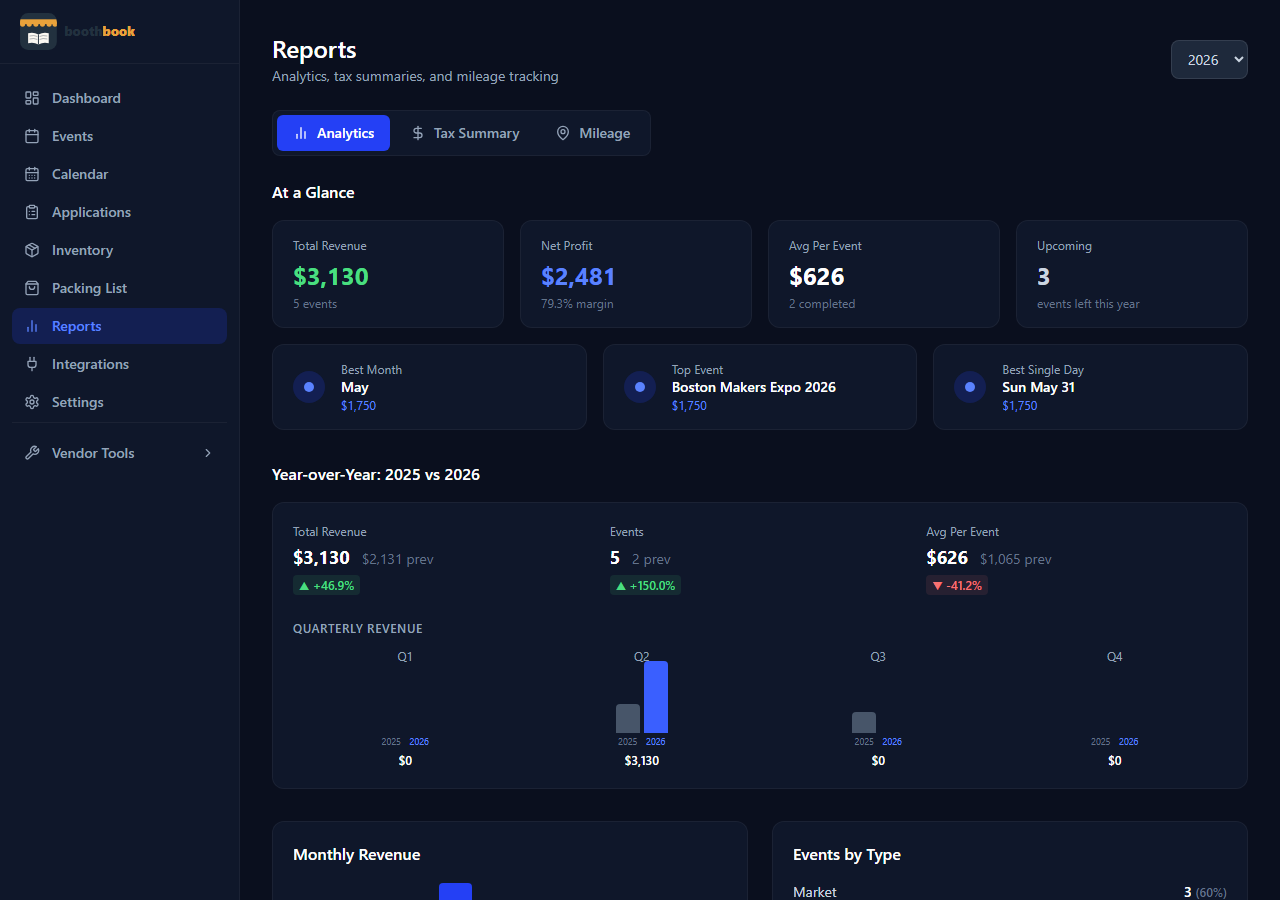
Reports & Taxes
Understand the analytics dashboard
Walk through every section of the Analytics dashboard — year-over-year comparisons, quarterly revenue charts, top events, and expense breakdowns.
- 1Go to Dashboard → Reports → Analytics.
- 2The top section shows year-to-date income, expenses, and net profit compared to last year.
- 3The bar chart breaks down revenue by quarter so you can spot seasonal patterns.
- 4Scroll down to see your top 5 events ranked by net income — useful for deciding which shows to re-apply to.
- 5The cost breakdown pie chart shows how your expenses split between booth fees, mileage, and other costs.
- 6Use the year selector at the top right to compare any two years.
Related guides
Run a tax report
Generate a complete year-end tax summary — income, expenses, and mileage deductions — and export it as a CSV to hand to your accountant.
Set an annual income goal
Set a yearly revenue target and watch a live progress bar on your dashboard update as you log events throughout the season.